What's in a tweet? Researchers use social media to measure national mood

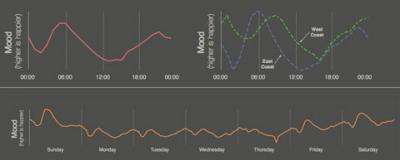
Tweeters on the West Coast are considerably happier than those on the East Coast, and Twitter users are happiest on Sunday mornings and unhappiest on Thursday evenings.
So say a team of researchers from Northeastern University and Harvard Medical School, who recently analyzed the language of 300 million tweets in an effort to measure the collective happiness of people across the country.
All of their data is represented in a modified map of the United States that tracks the mood of users throughout the day.
By gaining access to real-time data, researchers say they could eventually explain how the collective mood of Twitter Nation changes in response to specific events, such as a sudden dip in the stock market, or the results of the Super Bowl.
"Our method is a new way to extract information about people everywhere,” said Sune Lehmann, a postdoctoral research associate in the College of Computer and Information Science at Northeastern, who contributed to the ongoing study of the characteristics and dynamics of Twitter.
“Using this strategy, we could track how ideas and Internet memes spread,” he added.
Other collaborators included Northeastern’s Alan Mislove, an assistant professor of computer and information science; Yong-Yeol Ahn, a postdoctoral research associate at Northeastern’s Center for Complex Network Research; and Jukka-Pekka Onnela, and J. Niels Rosenquist, both of Harvard Medical School.
Researchers were able to infer the mood of each tweet using a psychological word-rating system developed by the National Institute of Mental Health’s Center for the Study of Emotion and Attention. The system ranks words based on how they make people feel.
Tweets containing words such as “love,” or triumph,” for example, received high mood scores, whereas messages with words such as “hell,” or “death” earned low marks.
Researchers then calculated an hour-by-hour average mood score for users in each state, and geographically represented the data using a density-equalizing map in which each region is scaled to represent its number of tweets as opposed to its land area.
Sparsely populated states rack up far fewer tweets than those in more densely populated regions, leading to “higher fluctuations in mood that do not represent the underlying data and create too much [visual] ‘noise’ when using a regular U.S. map,” noted Mislove.
More information:
Provided by Northeastern University


