Weather forecasts could become more challenging during the coronavirus storm

The COVID-19 pandemic has disrupted several sectors and meteorology is no exception. The quality and quantity of the observational data that feed into weather forecasting models could well be affected by the pandemic, according to the .
Knowing the state of the atmosphere is essential for good weather forecasting. In addition to announcing rain or sunshine, weather forecasts allow us to better prepare for risks and other weather hazards such as and hurricanes.
The pandemic has curtailed a number of these observations in a variety of ways. But scientists around the world are finding ways to fill some of those gaps.
International collaboration
The provides observations of the atmosphere, such as wind speed, and the ocean surface, namely sea surface temperature. The system comes from the close collaboration between national and international agencies that provide measurements from different observing instruments.
The relies on observations taken on land, in the air, on the ocean and from space. More than 10,000 surface-based stations, 1,000 weather balloon stations, 3,000 commercial aircraft, 7,000 ships, 100 moored buoys, 1,000 drifting buoys, 30 meteorological satellites and 200 research satellites gather information about the Earth.
The frequency and spatial distribution of these measurements vary enormously depending on the type of observation. For example, a surface weather station can collect precipitation measurements every five minutes, while the satellite, dedicated to global cloud observation, takes measurements covering the same geographical area every 16 days.
 Global Observing System is composed of a large number of in situ and satellite observing systems. Credit: World Meteorological Organization")
How forecasts are made
Atmospheric models are a set of equations that describe the changing state of the atmosphere. They require information about the initial state of the atmosphere and the Earth's surface (land and ocean) in order to provide weather forecasts.
Unfortunately, observational data alone are not sufficient to provide a complete picture of the state of the atmosphere because they are distributed irregularly over space and time, and sometimes contain errors.
This is where a technique known as "" comes into play. It involves combining observational data with data obtained from an atmospheric model to get the best estimate of the state of the atmosphere. In other words, one starts from a weather forecast made with the model and corrects it with the observational data.
The result of the data assimilation is a coherent complete image of the atmosphere and the Earth's surface at a given time. Once the initial state of the atmosphere and Earth's surface is known, an atmospheric model can be applied to predict its evolution.

The impact of the pandemic
The COVID-19 pandemic has caused a made by commercial aircraft, due to the decrease in air traffic. In Europe, for example, there has been a decline in the daily number of flights.
There has also been a drop in manual observations at surface weather stations in several developing countries, which have not switched to fully automated measurements. In the long term, other components of the observing system could be negatively affected if maintenance, repair and replenishment work cannot be done.
Each type of observation has a different impact on the quality of forecasts. conducted by the European Centre for Medium-Range Weather Forecasts (ECMWF) have shown that in the absence of aircraft meteorological data, the quality of short-term wind and temperature forecasts at cruising altitude decreases by 15 percent, which can affect the prediction of the jet stream and, consequently, forecasts of winter storms and heat waves. The quality of near-surface forecasts also decreases, but not as much.
Ironically, the importance of aircraft observation data was highlighted in mid-February 2020 at an ECMWF . Fortunately, the impact of satellite observations on forecast quality is greater than that of aircraft meteorological data.
-
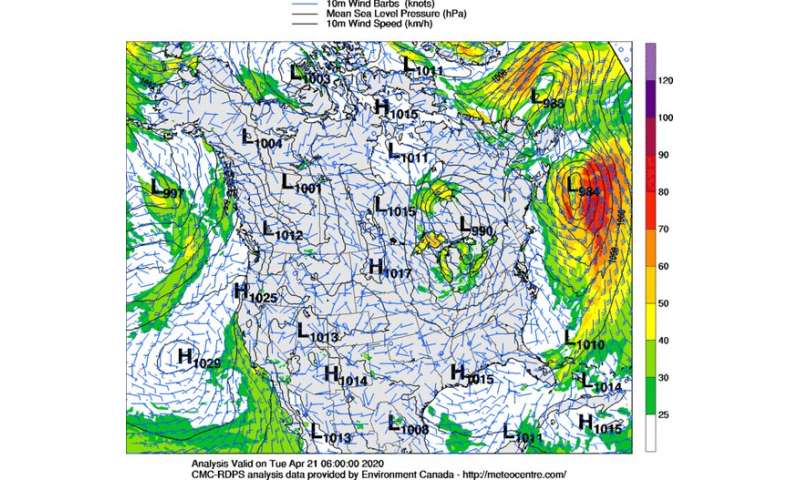
An example of an analysis of the Regional Deterministic Prediction System (RDPS) at the Canadian Meteorological Centre (CMC). Wind speed (in knots) is represented by the colours and wind direction is represented by the blue arrows. The black isolines represent sea level pressure. Credit: MeteoCentre -
Credit: KoolShooters from Pexels
Mobilizing scientists
The scientific community is trying to ease the impact of the decrease in observational data collected by aircraft. As a result, European national meteorological services are .
Observations from recently launched satellites can also help to fill the gap left by declining observations. This is the case of the , which provides wind data at different altitudes.
The declining quality of weather forecasts adds to the many challenges posed by the pandemic. With the expected to be more active than usual, it is even more important to correctly forecast the trajectory and intensity of hurricanes. Indeed, for , where the peak of COVID-19 cases is expected just before the start of the hurricane season, the pandemic is a major obstacle in preparing for this meteorological hazard.
Provided by The Conversation
This article is republished from under a Creative Commons license. Read the .![]()


